I have being playing today with perf on latest available kernel in Fedora (3.13). These are just some observations and thoughts.
perf trace
This tool is similar to strace, but almost without overhead. Contrary to strace, you can use perf trace to watch syscalls system wide or system calls generated by processes owned by certain user.
perf top
Function names are shown correctly and -g parameter is now available. It means that you can get call traces in a real time (without perf record).
perf timechart
This tool creates cool looking diagrams of a system workload.

perf sched
This tool shows you very verbose system scheduler statistics. Including latencies for a particular process. You can see if your server wasn’t available because of scheduler.
I don’t know what for, but perf sched can replay previously recorded system load. Maybe it is useful for scheduler development and optimization.
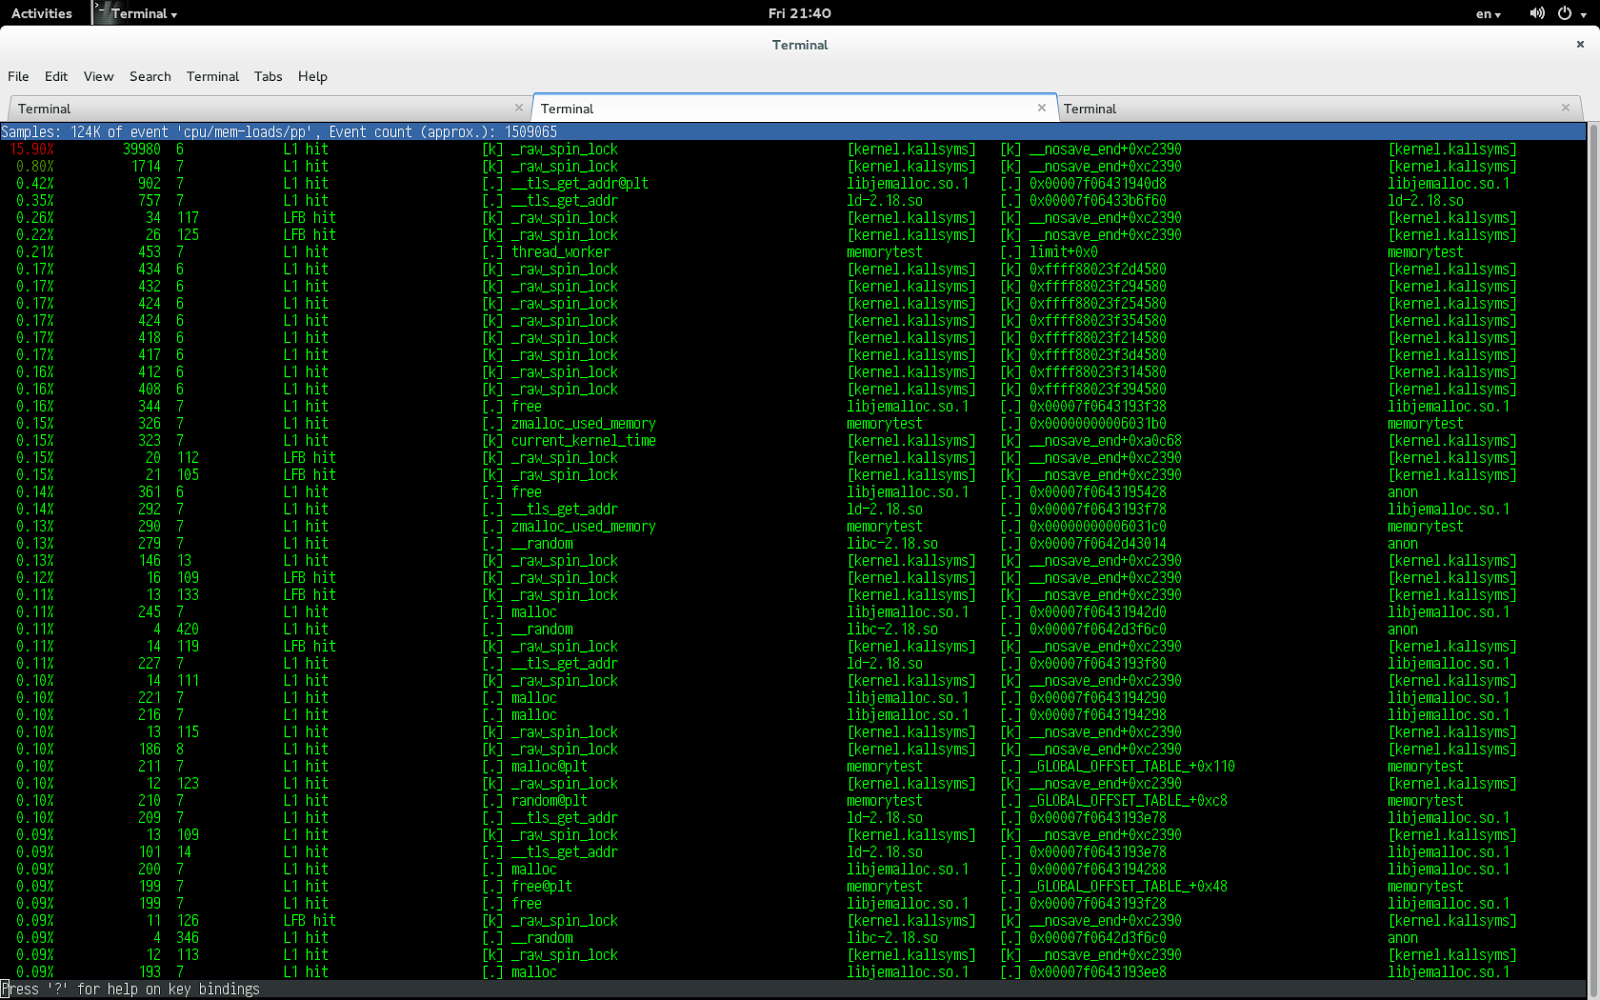
perf mem
This tool collects memory requests. It can show you whether your memory request was served by CPU cashe or not for example.
perf lock
This tool presumably allows you to collect information about various locks in your process and in the kernel, but it’s not working on a last Fedora kernel because it lacks particular option:
$ sudo perf lock record -p 12727
tracepoint lock:lock_acquire is not enabled. Are CONFIG_LOCKDEP and CONFIG_LOCK_STAT enabled?